Drink for thoughts
We Fund the Forward-Thinking Water Research
& Education that Is Vital to our Health.

Children are used to nutritional recommendations focusing on food intake. Yet, both the quantity and quality of the beverages they drink every day can be a game changer for their well-being and long-term health.
There is still so much we can do to strengthen education around water and nutrition, mostly when it comes to water drinking habits !
*Survey published in 2019 in the Journal of American Medical Association Pediatrics
The increase is especially troubling amid the pandemic.
Diabetes is one of the chronic medical conditions that increase the risk that a coronavirus infection will lead to severe illness, hospitalization or even death.
Source: U.S. Preventive Services Task Force’s recom- mendation published in JAMA Network, August 24/31/2021
Choosing water drinking habits instead of sugary drinks from a young age would be a good place to start!
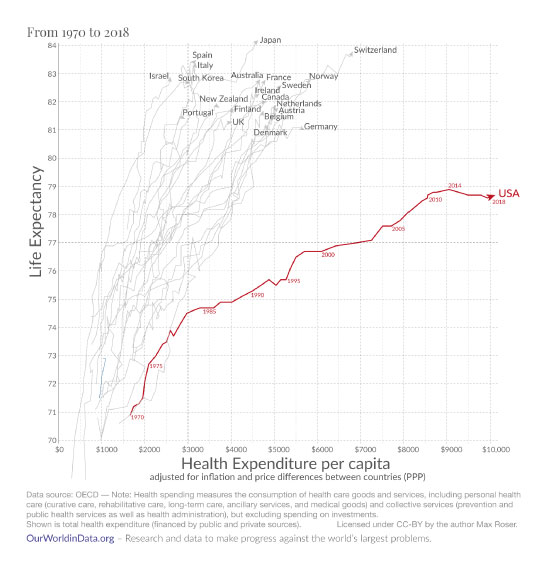
And while life expectancy for people around the world continued to increase, life expectancy of Americans has declined since 2014.
Estimate of the death rate from obesity related factors is higher in the US than in any other countries.
We can do better! And it all begins with good water drinking habits.
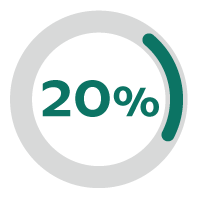
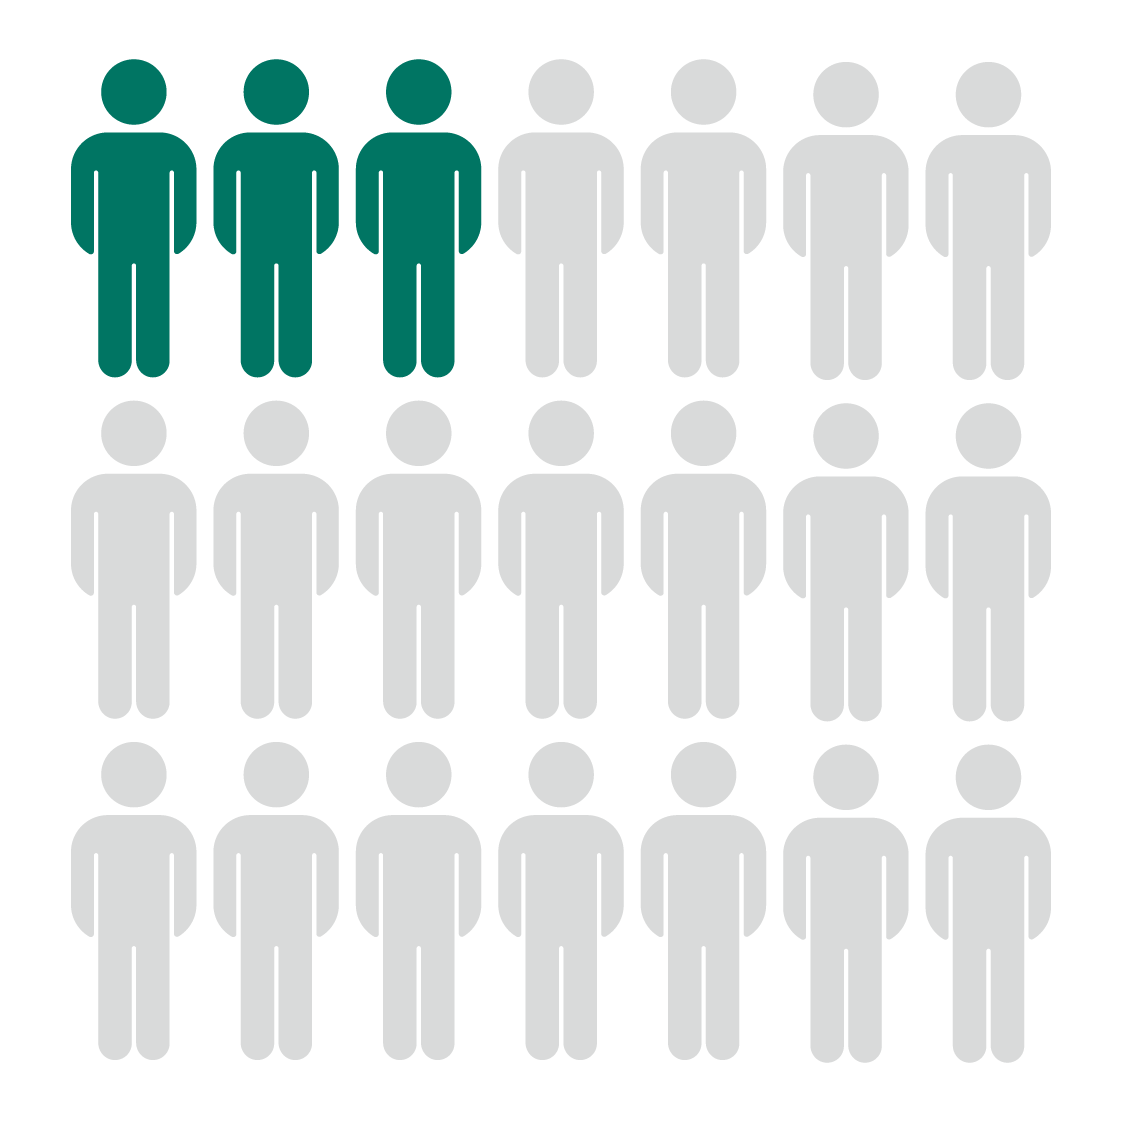
Finally we’re looking into water quality standards in food production including fresh produce processing and livestock. Why? We typically get about 20% of the water we need from the food we eat! Fruits and vegetables contain from 75% up to 96% of water while lean meat and poultry muscle is approximately 75 % water. Let’s try now to picture that amount of water as part of our regular intake… Huge!
Poor quality of the water used among farm water supplies can have great detrimental impact on final products (contamination from microorganisms, chemicals, pollutants etc.) Yet, the fundamental importance of water quality in irrigation, in livestock drinking and overall food production is often underestimated.
In the context of crop productivity increasing at a rapid pace to meet global demand and specifically meat plants’ needs, strict water quality standards are necessary, not just for drinking water, but for our whole food supply chain: agriculture, livestock conditions, food processing and preparation.

Food is the main source of “virtual water” consumption. In fact, the average American consumes an average of 1004 gallons of water everyday or, in other words, about 33,000 glasses of virtual water every day.
36 gallons
Our Domestic Consumption
(Drinking is only 4%)
44 gallons
Water for Industrial Products we Use Daily
(Cotton, paper, clothes)
924 gallons
Water used for the food we eat
& specifically 4,068 gallons of water used for 2 pounds of beef.